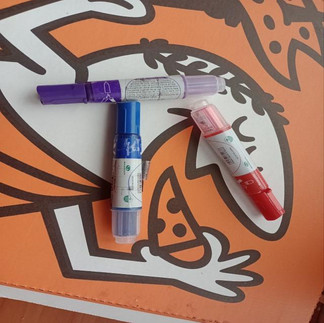
We have a model that detects different types of whiteboard markers. The problem is that in the office, we have not only markers, but also pencils, pens, and other tubular-shaped objects. We don't want to detect those pencils and other objects, but our trained model mistakenly detects the pens as colored markers. Today we will be trying to solve that problem by adding some pens to our dataset without having our model to detect them. Training with these objects present in the images will greatly improve the placement of the bounding boxes: the out of distribution objects will no longer be detected.
Our experiment
We will be detecting images of markers in an office. For that task, we put through a testing dataset, composed of images in the tables and floor of an office, but also adding some extra items to the images such as coffee cups, computers or other pens that would be present in a normal office. These are some of the testing images we will be using:
To build a dataset to detect the markers in this image, we will be using our KIADAM tool. We will be constructing the dataset images from segmented marker images as objects and unsplash backgrounds as backgrounds.
Learn how to use Meta's Segment Anything tool to precisely crop your images here
Detecting the testing images 'as-is'
Follow along with our Colab Notebook
Our first experiment consists of building a dataset with some basic augmentations, using only markers as objects. We will also try to detect the correct color on the markers. After training a YOLOv8 model, we have a mAP@50 of 0.857, and these first detection results:

We can also see the confusion matrix:

Clearly we detect fairly well our markers. Nonetheless, we are also detecting some other objects present in the image: some pens are being detected as markers, and also some parts of the chair or even the window. We do indeed detect 24 times the background as a marker. Next we try to solve this problem.
Adding out of distribution to the dataset
To fix the previous problem, we will be adding some ood objects to the dataset. These objects will not be surrounded by bounding boxes, so it only will help the model learn that those objects don't need to be detected. An example of ood object added to the image is this pen:

As you can see, in this image we have some markers (the blue and purple one) but also many pens, which count as ood objects. Close to 50% of all objects in an image will be ood objects. After training, we have a mAP@50 of 0.792 and these detections:

Let's see the confusion matrix:

Even if the mAP@50 is lower than the previous experiment, we can see that the pens in the image are no longer detected, and we detect only 12 times the background as an image, (less than half what we had previously), which is exactly what we were trying to accomplish. But, having that solved, we will focus on solving the lower metrics. We will hypothetize that not enough markers were present in the images, so we will be changing that in the next experiment.
Lowering the percent of ood objects
In the previous experiment, we had 50% of all objects in the generated images to be of ood kind (unlabeled and with no bounding box). In this experiment, we will lower that percentage, to have approximately 25% of all objects being ood. That said, if we had 8 objects in the image, chances are that 2 will be ood (pens) and 6 will be markers, as opposed to 4 ood and 4 markers in the previous experiment. After training, we managed to raise the mAP@50 to 0.808, but still conserving the property of not detecting the pens in the image, as seen in this next image:

Let's see the final confusion matrix:

Conclusion
We started with the task of detecting some markers in an office setting. To avoid detecting other similar-shaped objects present in the office, we added a frequent office object to our training dataset (pens and pencils), and avoided adding bounding boxes to those objects, to train the model to NOT detect them. By doing so, we lowered a little bit our mAP@50, but by doing some adjustments to the percentage of ood objects in the image, we managed to get the best of both worlds, having a final mAP@50 of 0.808, but almost no out of distribution objects detected in our testing dataset, having only detected 6 times the background as marker (less than a fourth than what we had initially).
Our recommendations are the following:
Add some frequently seen objects of your production environments, which share some similarities with the objects you desire to detect, to your KIADAM dataset as out of distribution objects. We will be going deeper into this subject in part 2, where we will be adding more types of out of distribution objects to the dataset. This will improve the locations of your bounding boxes, allowing your model to be more precise on its detections.
If your metrics fall by doing this, you can adjust the percentage of out of distribution objects in your image to have the best results.
If you want to further improve your detection metrics, you can later augment the number of images, train for more epochs, add some transformations or adjust some of the other configurations available in KIADAM.


