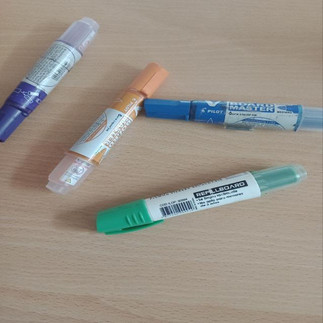
We have a model that detects different types of whiteboard markers. The problem is that in the office, we have not only markers, but also pencils, pens, and other tubular-shaped objects. We don't want to detect those pencils and other objects, but our trained model mistakenly detects the pens as colored markers. In part one, we trained a model with and without using Out Of Distribution objects and tested whether the addition of those objects helped to the detections. In this article, we will be continuing to test the effectiveness of the approach of adding pens as out of distribution objects to our synthetically generated dataset (using the KIADAM tool), but in a more simple setting to isolate the ood factor.
Our Experiment
Follow along with our Colab Notebook
In part 1 of this article, we had the task of recognizing markers in an office setting. For that task, we put through a testing dataset, composed of images of the tables and floor of an office, but also adding some extra items to the images such as coffee cups, computers or other pens that would be present in a normal office. In this article, we will be using a different testing set, which is composed of very simple images, where some of them have some extra pencils that should not be detected. Here are some images of that dataset:
The goal is to be able to detect the markers, without detecting the pens nor the lighting that sometimes happens on the table.
Training a model without ood objects in the synthetic images
The first thing we will do will be to train the model with a synthetically generated dataset, composed of the same markers of the previous part. There are some differences, though. a first difference is the background used, we will be using wood-like backgrounds to match the backgrounds present in the testing images. This will be to minimize the noise present when detecting the markers. A second difference will be that we will not have different labels for markers of different colors, but only one label "marker", to avoid the model's confusion when choosing the color of the markers. We will be using again some base transformations to generate the dataset. Let's see an image from the dataset:

As you can see, if we ignore the fact that some markers are bigger and others are smaller, the image seems as if it were a real photo of markers in a table, although a little blurry. When training with this dataset, we had these results:
Model | Yolov8 |
Precision | 0.937 |
Recall | 0.878 |
mAP@50 | 0.952 |
We have here some pretty good results. This is mainly because our dataset is very simple, and our training images are very similar to our testing images. Let's see the detections:

When detecting the single markers, the model ocasionally does some mistakes. But in the photos with multiple markers, and extra pens that sould not be detected, the model detects much more bounding boxes than those that should be detected. Let's try detecting but adding some ood images of pens to the training dataset.
Improving the results by adding Out Of Distribution objects
The next experiment will be to add some OOD pens and pencils to the training dataset. After having the dataset generated, we use it to train a Yolov8 model, and have the results shown next:
Model | Yolov8 |
Precision | 0.954 |
Recall | 0.915 |
mAP@50 | 0.944 |
We can see that the Precision and Recall improved greatly. The mAP@50 only lowered by 0.008, what is considered a negligeably change. Let's continue to see the detections with this dataset:

The first thing we can note, is that when we had single markers, we no longer have the multiple bounding boxes around the object, as we had in the previous experiment. Only when the image is very crouded, we still have some detection noise with the out of distribution pens. But, even if that is the case, we can say that the predictions seem a little more clean, and that is supported by the numerical results.
Conclusion
In this article, we took the previous experiment, and simplified it. We did so to test in a controlled environment whether the out of distribution images added to the synthetically generated dataset helped to improve the detection of images with markers and similarly-shaped pens. We can clearly see that the addition of those OOD objects augmented the metrics and diminished the amount of times the pens were detected.
As a recommendation, you should add OOD images to your KIADAM generated dataset, if you have objects A and B in your production environment, that are similarly shaped, but only object A must be detected. In that case, you should add segmented images of objects in the same distribution of those that should not be detected (object B in this case), to increase the metrics and have better detection.


